![]()
Time Resampling
DatetimeIndex(['2025-07-06', '2025-07-13', '2025-07-20', '2025-07-27'], dtype='datetime64[ns]', freq='W-SUN')| ALIAS | DESCRIPTION |
|---|---|
| B | business day frequency |
| C | custom business day frequency (experimental) |
| D | calendar day frequency |
| W | weekly frequency |
| M | month end frequency |
| SM | semi-month end frequency (15th and end of month) |
| BM | business month end frequency |
| CBM | custom business month end frequency |
| MS | month start frequency |
| SMS | semi-month start frequency (1st and 15th) |
| BMS | business month start frequency |
| CBMS | custom business month start frequency |
| Q | quarter end frequency |
| intentionally left blank |
| ALIAS | DESCRIPTION |
|---|---|
| BQ | business quarter endfrequency |
| QS | quarter start frequency |
| BQS | business quarter start frequency |
| A | year end frequency |
| BA | business year end frequency |
| AS | year start frequency |
| BAS | business year start frequency |
| BH | business hour frequency |
| H | hourly frequency |
| T, min | minutely frequency |
| S | secondly frequency |
| L, ms | milliseconds |
| U, us | microseconds |
| N | nanoseconds |
| Date | Close | Volume | |
|---|---|---|---|
| 0 | 2015-01-02 | 38.0061 | 6906098 |
| 1 | 2015-01-05 | 37.2781 | 11623796 |
| 2 | 2015-01-06 | 36.9748 | 7664340 |
| 3 | 2015-01-07 | 37.8848 | 9732554 |
| 4 | 2015-01-08 | 38.4961 | 13170548 |
<class 'pandas.core.frame.DataFrame'>
RangeIndex: 1006 entries, 0 to 1005
Data columns (total 3 columns):
 #   Column  Non-Null Count  Dtype
---  ------  --------------  -----
 0   Date    1006 non-null   object
 1   Close   1006 non-null   float64
 2   Volume  1006 non-null   int64
dtypes: float64(1), int64(1), object(1)
memory usage: 23.7+ KB| Close | Volume | |
|---|---|---|
| Date | ||
| 2015-01-02 | 38.0061 | 6906098 |
| 2015-01-05 | 37.2781 | 11623796 |
| 2015-01-06 | 36.9748 | 7664340 |
| 2015-01-07 | 37.8848 | 9732554 |
| 2015-01-08 | 38.4961 | 13170548 |
| ... | ... | ... |
| 2018-12-24 | 60.5600 | 6323252 |
| 2018-12-26 | 63.0800 | 16646238 |
| 2018-12-27 | 63.2000 | 11308081 |
| 2018-12-28 | 63.3900 | 7712127 |
| 2018-12-31 | 64.4000 | 7690183 |
1006 rows × 2 columns
| Close | Volume | |
|---|---|---|
| Date | ||
| 2015-01-02 | 38.0061 | 6906098 |
| 2015-01-05 | 37.2781 | 11623796 |
| 2015-01-06 | 36.9748 | 7664340 |
| 2015-01-07 | 37.8848 | 9732554 |
| 2015-01-08 | 38.4961 | 13170548 |
<class 'pandas.core.frame.DataFrame'>
DatetimeIndex: 1006 entries, 2015-01-02 to 2018-12-31
Data columns (total 2 columns):
 #   Column  Non-Null Count  Dtype
---  ------  --------------  -----
 0   Close   1006 non-null   float64
 1   Volume  1006 non-null   int64
dtypes: float64(1), int64(1)
memory usage: 23.6 KBFull date range with business days:
DatetimeIndex(['2015-01-02', '2015-01-05', '2015-01-06', '2015-01-07',
'2015-01-08', '2015-01-09', '2015-01-12', '2015-01-13',
'2015-01-14', '2015-01-15',
...
'2018-12-18', '2018-12-19', '2018-12-20', '2018-12-21',
'2018-12-24', '2018-12-25', '2018-12-26', '2018-12-27',
'2018-12-28', '2018-12-31'],
dtype='datetime64[ns]', length=1042, freq='B')| Close | Volume | |
|---|---|---|
| Date | ||
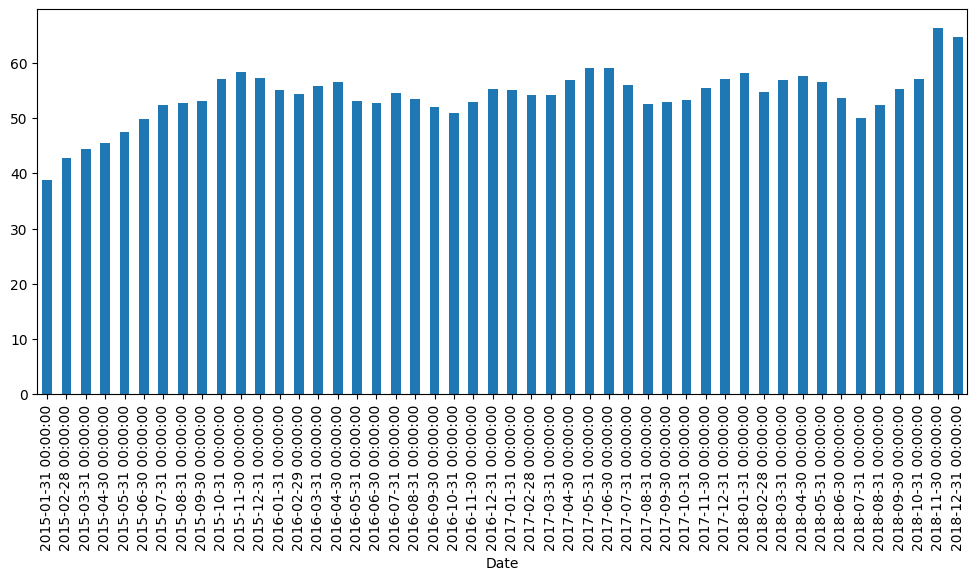
| 2015-01-31 | 38.729470 | 1.336800e+07 |
| 2015-02-28 | 42.862432 | 7.908719e+06 |
| 2015-03-31 | 44.321836 | 8.905969e+06 |
| 2015-04-30 | 45.508914 | 8.540996e+06 |
| 2015-05-31 | 47.488650 | 6.723716e+06 |
| 2015-06-30 | 49.761627 | 6.856079e+06 |
| 2015-07-31 | 52.437959 | 8.087759e+06 |
| 2015-08-31 | 52.797976 | 1.064881e+07 |
| 2015-09-30 | 53.006186 | 8.935548e+06 |
| 2015-10-31 | 57.051373 | 8.893461e+06 |
| 2015-11-30 | 58.296355 | 7.077431e+06 |
| 2015-12-31 | 57.219514 | 7.952858e+06 |
| 2016-01-31 | 55.138963 | 1.383605e+07 |
| 2016-02-29 | 54.446810 | 1.119357e+07 |
| 2016-03-31 | 55.858968 | 8.203693e+06 |
| 2016-04-30 | 56.531200 | 9.407233e+06 |
| 2016-05-31 | 53.016571 | 7.849410e+06 |
| 2016-06-30 | 52.669300 | 8.495649e+06 |
| 2016-07-31 | 54.551905 | 1.018464e+07 |
| 2016-08-31 | 53.518291 | 7.797496e+06 |
| 2016-09-30 | 52.022771 | 9.178403e+06 |
| 2016-10-31 | 50.945319 | 7.073672e+06 |
| 2016-11-30 | 52.845452 | 1.128694e+07 |
| 2016-12-31 | 55.331981 | 7.898740e+06 |
| 2017-01-31 | 55.057330 | 9.438392e+06 |
| 2017-02-28 | 54.157374 | 1.032388e+07 |
| 2017-03-31 | 54.155570 | 9.806376e+06 |
| 2017-04-30 | 56.968300 | 9.546442e+06 |
| 2017-05-31 | 59.081968 | 7.295628e+06 |
| 2017-06-30 | 59.031950 | 7.745303e+06 |
| 2017-07-31 | 55.933905 | 1.105518e+07 |
| 2017-08-31 | 52.567952 | 1.024694e+07 |
| 2017-09-30 | 52.995195 | 9.225082e+06 |
| 2017-10-31 | 53.310614 | 8.129790e+06 |
| 2017-11-30 | 55.359462 | 1.025010e+07 |
| 2017-12-31 | 57.006955 | 8.758599e+06 |
| 2018-01-31 | 58.205433 | 1.155463e+07 |
| 2018-02-28 | 54.729784 | 1.255456e+07 |
| 2018-03-31 | 56.913367 | 8.852274e+06 |
| 2018-04-30 | 57.635371 | 8.503481e+06 |
| 2018-05-31 | 56.482395 | 6.841657e+06 |
| 2018-06-30 | 53.663433 | 1.612197e+07 |
| 2018-07-31 | 50.105995 | 1.165892e+07 |
| 2018-08-31 | 52.279430 | 8.617108e+06 |
| 2018-09-30 | 55.234000 | 9.342414e+06 |
| 2018-10-31 | 57.035104 | 1.243318e+07 |
| 2018-11-30 | 66.363652 | 1.557092e+07 |
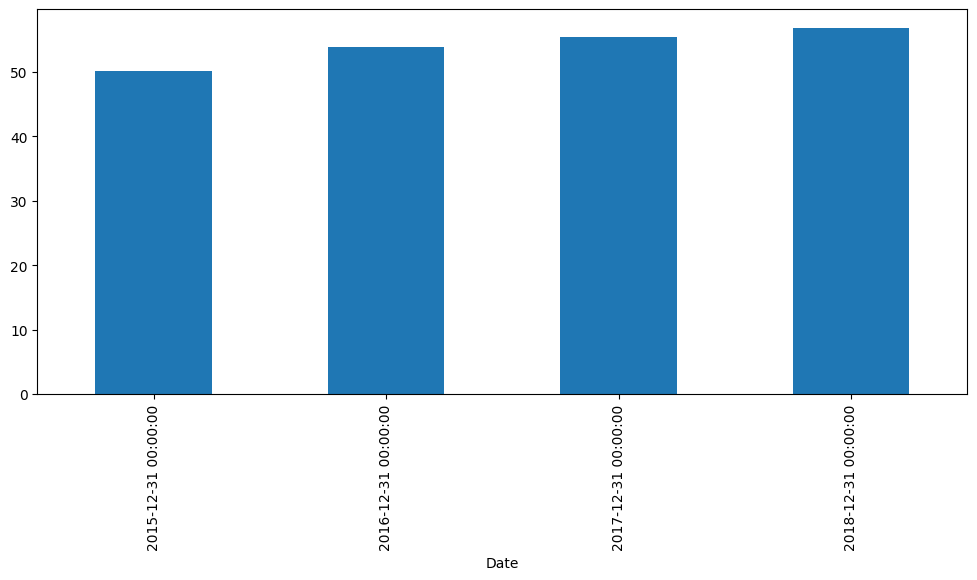
| 2018-12-31 | 64.609474 | 1.316915e+07 |
| Close | Volume | |
|---|---|---|
| Date | ||
| 2015-01-02 | 38.0061 | 6906098 |
| 2015-01-05 | 37.2781 | 11623796 |
| 2015-01-06 | 36.9748 | 7664340 |
| 2015-01-07 | 37.8848 | 9732554 |
| 2015-01-08 | 38.4961 | 13170548 |
| ... | ... | ... |
| 2018-12-24 | 60.5600 | 6323252 |
| 2018-12-26 | 63.0800 | 16646238 |
| 2018-12-27 | 63.2000 | 11308081 |
| 2018-12-28 | 63.3900 | 7712127 |
| 2018-12-31 | 64.4000 | 7690183 |
1006 rows × 2 columns