Locally Estimated Scatterplot Smoothing (LOESS)
Seasonal-Trend-LOESS (STL) Decomposition
- Variety seasonal pattern
- Handle outliers in time series data
- Only handle additive data
import pandas as pd
import numpy as np
import matplotlib.pyplot as plt
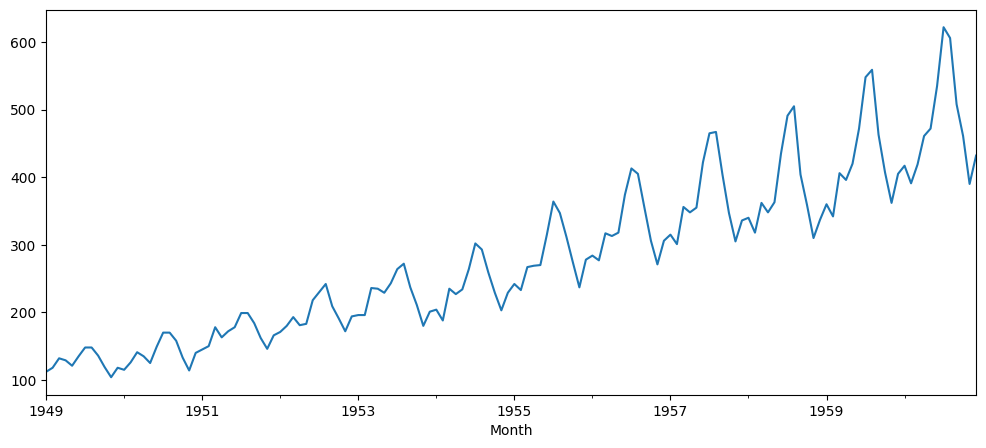
# Using airline passenger dataset (monthly totals)
url = 'https://raw.githubusercontent.com/jbrownlee/Datasets/master/airline-passengers.csv'
df = pd.read_csv(url, parse_dates=['Month'], index_col='Month')
df
| Month |
|
| 1949-01-01 |
112 |
| 1949-02-01 |
118 |
| 1949-03-01 |
132 |
| 1949-04-01 |
129 |
| 1949-05-01 |
121 |
| ... |
... |
| 1960-08-01 |
606 |
| 1960-09-01 |
508 |
| 1960-10-01 |
461 |
| 1960-11-01 |
390 |
| 1960-12-01 |
432 |
144 rows × 1 columns
df["Passengers"].plot(figsize = (12,5))
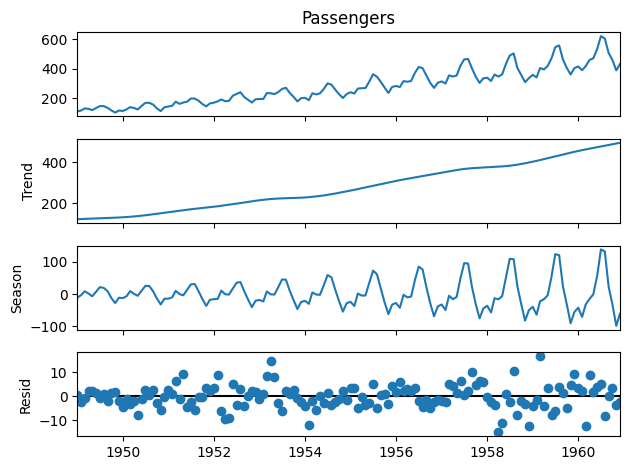
from statsmodels.tsa.seasonal import STL
res = STL(df["Passengers"]).fit()

res.plot()
plt.figure(figsize = (12,5))
plt.show()
<Figure size 1200x500 with 0 Axes>