from IPython.display import HTML
from matplotlib import animation
prev_norm = norm_theta(pi, centres, cov)
fig, ax = plt.subplots()
artists = []
while True:
l = Max(pi, centres, cov)
pi, centres, cov = Exp(l)
frame = []
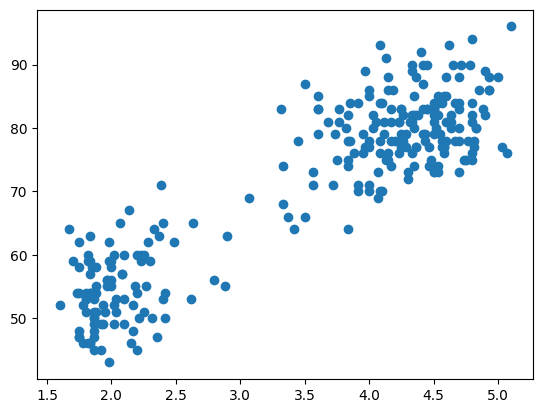
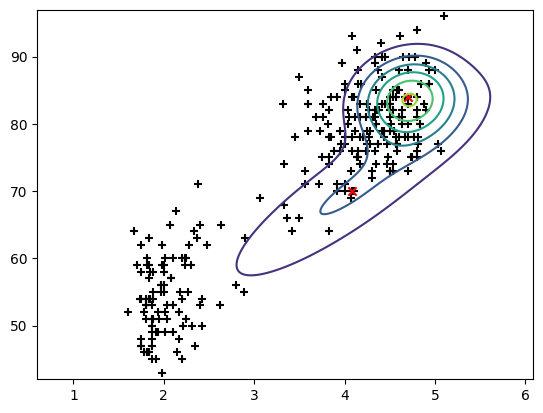
frame.append(ax.scatter(X[:, 0], X[:, 1], color='black', marker='+'))
frame.append(ax.scatter(centres[:, 0], centres[:, 1], color='red', marker='x'))
probability_grid = np.zeros(grid.shape[:2])
for i in range(K):
probability_grid += pi[i] * multivariate_normal(centres[i], cov[i]).pdf(grid)
frame += list(ax.contour(M, N, probability_grid).collections)
artists.append(frame)
curr_norm = norm_theta(pi, centres, cov)
if abs(curr_norm-prev_norm) < 1:
break
else:
prev_norm = curr_norm
plt.close()
anim = animation.ArtistAnimation(fig, artists, interval=200, repeat=False, blit=False);
HTML(anim.to_jshtml())