from sklearn.metrics import f1_score

y_true = [0, 1, 1, 1, 0, 1]
y_pred = [0, 1, 0, 1, 0, 1]

f1_score(y_true, y_pred)0.8571428571428571The f1_score is a metric that combines precision and recall into a single value and can be interpreted as the harmonic mean of the two.
The formula for the F1 Score is:
\displaystyle \text{F1 Score} = 2 \cdot \frac{\text{Precision} \cdot \text{Recall}}{\text{Precision} + \text{Recall}}
The F1 Score ranges from 0 to 1, where 1 indicates perfect precision and recall, and the lowest possible value is 0, if either precision or recall is 0.
\displaystyle \text{F1 Score} = \frac{2 \cdot \text{TP}}{2 \cdot \text{TP} + \text{FP} + \text{FN}}
Where, TP = True Positives FP = False Positives FN = False Negatives
f1_score is the function in scikit-learn used to calculate the F1 Score.
The parameters are as follows:
y_true: Ground truth (correct) labels.y_pred: Predicted labels, as returned by a classifier.labels (None): The set of labels to include when average is not None.pos_label (1): The label of the positive class.average (‘binary’): The averaging strategy for multiclass settings.sample_weight (None): Sample weights.from sklearn.metrics import f1_score
y_true = [0, 1, 1, 1, 0, 1]
y_pred = [0, 1, 0, 1, 0, 1]
f1_score(y_true, y_pred)0.8571428571428571We are going to calculate the F1 Score of a support vector machine (SVM) classifier model on the breast_cancer dataset using sklearn.
from sklearn.datasets import load_breast_cancer
from sklearn.model_selection import train_test_split
from sklearn.svm import SVC

X, y = load_breast_cancer(return_X_y=True, as_frame=True)
X_train, X_test, y_train, y_test = train_test_split(X, y, test_size=0.25, random_state=42)

model = SVC()
model.fit(X_train, y_train)

y_pred = model.predict(X_test)
f1_score(y_test, y_pred)0.9617486338797814from sklearn.metrics import ConfusionMatrixDisplay
ConfusionMatrixDisplay.from_estimator(model, X_test, y_test)<sklearn.metrics._plot.confusion_matrix.ConfusionMatrixDisplay at 0x7a881ea3f220>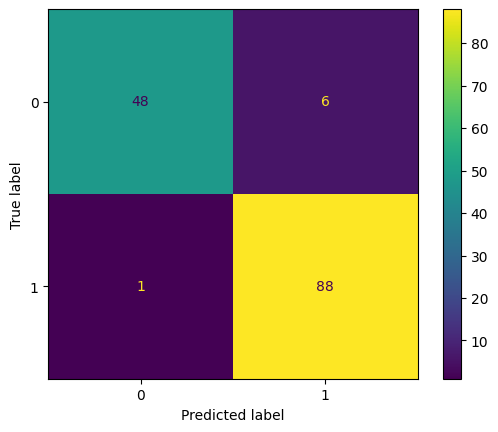
In the above matrix, we can see that: TP = 88, TN = 48, FP = 6, FN = 1
\begin{aligned} {\displaystyle \text{F1 Score}} & ={\displaystyle \frac{2 \cdot \text{TP}}{2 \cdot \text{TP} + \text{FP} + \text{FN}}}\\ & \\ & {\displaystyle =\frac{2 \cdot \text{88}}{2 \cdot \text{88 + 6 + 1}}}\\ & \\ & {\displaystyle =\ \frac{\text{176}}{\text{183}}}\\ & \\ & {\displaystyle =\ 0.9617} \end{aligned}